Published August 5, 2017 | Updated August 14, 2024 | 6 minute read
This article is the first of an ongoing series, “You Watch What You Measure” on how we are evaluating and measuring our impact at August.
At August, we’re big believers in using metrics to help drive change — ones that can be flexible depending on changing conditions and needs, and also tell a consistent story of impact over time. Every week, we report our weekly team metrics, and use various surveys to take the pulse of teams that we work and to see how they are evolving and changing.
Recently however, we’ve decided to take a more systematic approach which focuses on our big picture impact vs being tailored to specific situations and clients. We’ve developed some ideas around this via anecdotal data and our previous measurement efforts, but are using our evaluation process to dig even deeper and create a data-driven understanding of the change we create.
In following posts, I’ll share more on how we’ve been creating a system, the underlying factors that we’ve discovered, and share some of the tools we’ve been using to get there — but for today’s post, I’m going to share some analysis that we did with survey data of 265 attendees from a large client training, and how the data yielded some initial insights that ultimately helped shape (and predict) what interventions were the most powerful in driving change.
The Context
A few months ago, myself and another team member conducted a training with 100+ middle managers at one of our client organizations. The training focused on specific practices (strategies, consent-decision making, and retrospectives) that they as leaders could use to help drive change in their teams.
Prior to the training, as a way to assess the mindsets of these leaders, we distributed a Leadership Mindsets Survey that our team has developed (special credit to Erica Seldin and CPJ here) to try and understand the beliefs that respondents hold about how they work in and manage teams. The different questions map to specific behaviors (as measured by our Impact Survey) and practices.
 Mindsets -> Behaviors -> Practices
Not only did we ask participants to complete the survey, we also asked them to forward it to other managers and team members to help us get an honest assessment across a larger sample of the organization. In total, we had 256 people respond to the survey — our largest consistent dataset to date.
What We Found
While the most interesting insights came from conducting a statistical analysis on the dataset to identify the underlying factors that create the conditions for change (more on this in an upcoming post), just looking at the survey responses themselves yielded some interesting clues to how leaders within the organization think and the culture as a whole — and which ultimately predicted what we found to be the most sticky practices within the organization.
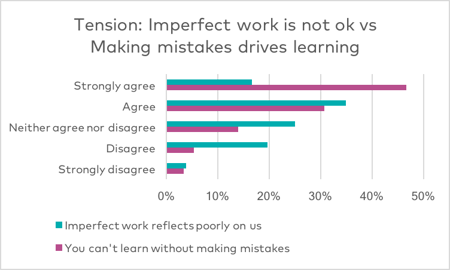
78% believed that failure is important to learning…but only 24% felt that delivering imperfect work doesn’t reflect poorly on their team.

There’s an inherent contradiction here, no? Delivering imperfect work assumes that there are mistakes built into the work, that there are things that are “wrong” or unfinished — yet while many of the leaders agreed making mistakes were essential to learning, only a few felt that the culture had created a supportive environment around delivering imperfect work. This tension suggested that there was a clear opportunity for us to create meaningful change via shifting mindsets and behaviors around how teams viewed sharing imperfect work and making an explicit connection that doing so would enable learning.
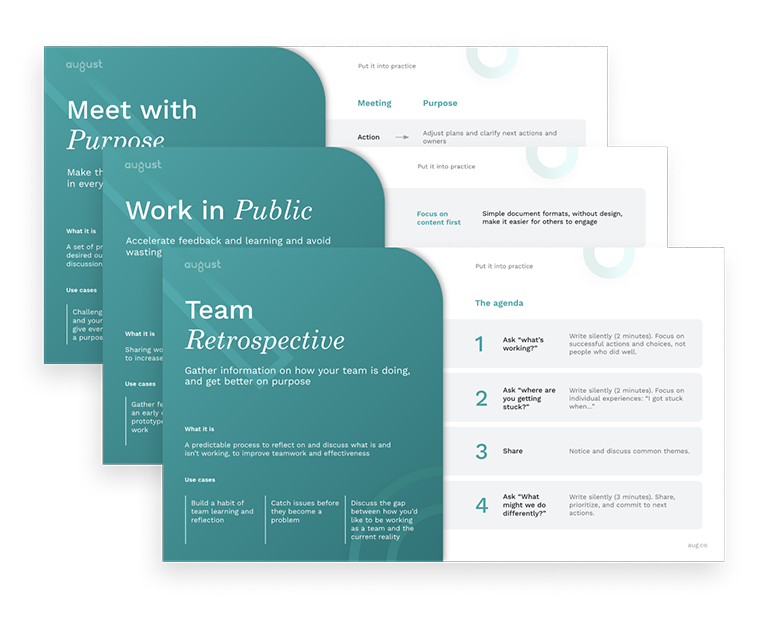
Sure enough, we found the practice of shipping weekly to be very powerful once we started coaching teams within the organization. This entailed encouraging teams to share imperfect/unfinished work on a continual basis, so that they could get useful feedback from their sponsors and stakeholders, and learn from what they hear and the mistakes they make. We heard from both the teams and their leaders that this both dramatically shifted how they engaged with one another and the speed at which they were able to learn from their mistakes and do their work.
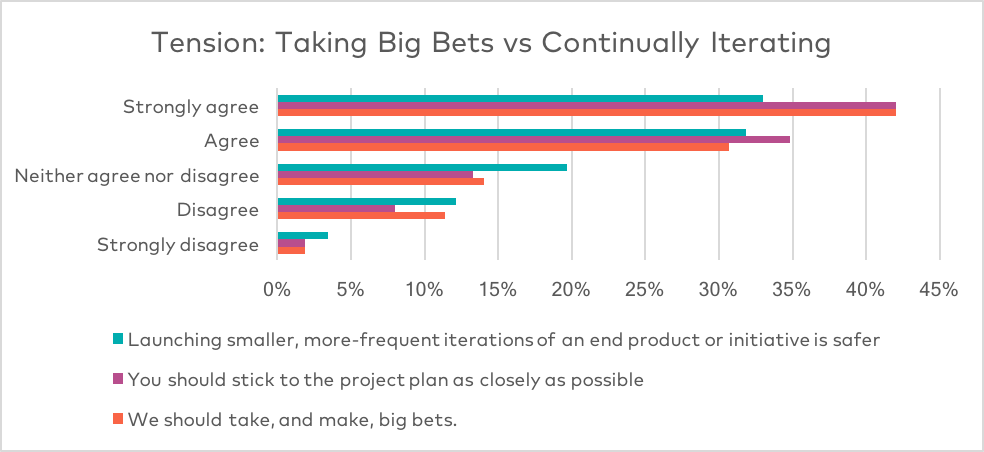
73% believed that taking big bets is the way to go — and even more (77%) think that sticking to a project plan as closely as possible is a good thing. But 65% think that it’s safer in general to launch smaller, more frequent iterations of a potential product or initiative.

There’s some definite contradiction going on here, part of which might possibly be explained by confusion in how the respondents interpreted the question. When we created the survey, what we meant by “big bets” was the practice of designing and developing major initiatives with little to no feedback from stakeholders or customers — which we’ve seen often results in failure at launch. Instead, we believe that constant iteration is necessary, as it allows you to learn, react, and change the project plan along the way.
The fact that the majority of respondents believe in big bets and continual iteration is seemingly at at odds. One potential explanation is that they might have interpreted “big bets” as taking risks in general — that it’s good to take risks to win big. But this also speaks to a cultural tension that we identified as inhibiting change — where teams often were given big, lofty goals to achieve — and while they theoretically believed in the concept of continual iteration, they had no idea how to break down their goals or how to structure their work to enable a continuous iterative process. Hence, their belief that the project plan is “sacred,” rather than a living, breathing thing that can evolve and change according to the latest information (and feedback) at hand.
To that end, the intervention, or practice, that we found to be most sticky in addressing this tension, was mission-driven structure. Mission-driven structures are captured within our Team Charter template which lays out all the elements of effective team design, where a larger purpose is mapped to a short-term mission, and clear roles and responsibilities are designated for each team member. We found that helping teams break down their desired “big bets” into short-term, achievable missions via the mission-driven structurewas a key unlock to helping them build continuous development cycles.
“Cadence” was the other component that helped teams embed continuous iteration into their work and embrace flexible project plans. By helping them structure their work into weekly sprints in service of their short-term mission, they were able to continually learn from their mistakes, reassess the work that needed to be done, and dynamically change course.
Implications for Future Work
There are many ways to try and diagnose problems and understand organizations — and we’re experimenting with many different ways at August. However, we’ve started to use our evaluation systems to developing a more robust approach to assess challenges across the organization and using the data to predict and inform the interventions that we do. As we apply the same measurement systems across organizations, we are starting to identify patterns and trends that will help us articulate the clear factors that predict and drive change for responsive organizations. More on that in our next evaluation post!


